— The #1 requested feature in Power BI
Expandable/Collapsible columns in Power BI Financial Reporting Matrix.
Expand and collapse your columns in Power BI
We are pleased to announce that the now-released Power BI Financial Reporting Matrix v4 has expandable and collapsible columns with summarization.
This is the number one requested feature in Power BI because it adds plenty of flexibility and the possibility to create great financial reports. People have used this functionality when creating financial reports in Excel for years, and it’s now finally possible in Power BI.
>> Watch the new features demo
>> Read Microsoft’s article on the benefits
New features in version 4:
>> Download v4 (license key required)
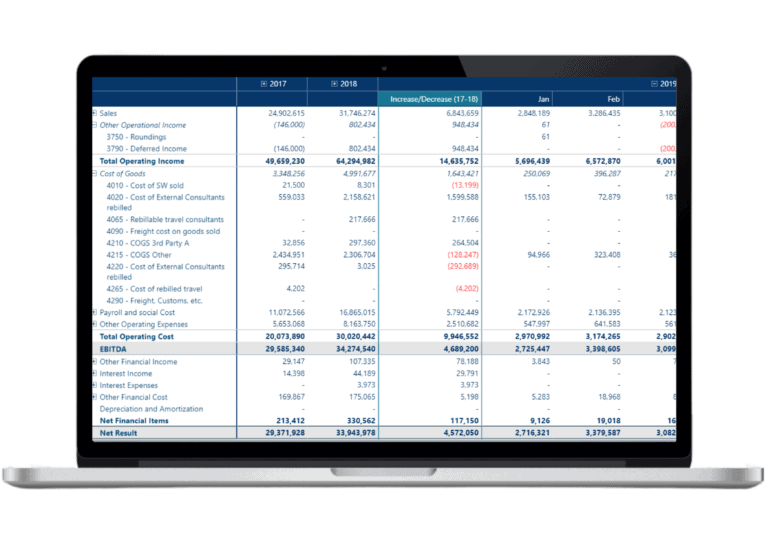
Expandable and collapsible columns with summarization
The highly requested expand and collapse column feature enables users to drill and summarize along both rows and columns. You can now group and summarize both vertically and horizontally, for example, by date or product categories, just like you can in “good old” Excel. Collapsed columns will automatically be summarized without any configuration or modeling required.
All in all, this Power BI financial reporting feature gives users greater flexibility to present and analyze their data and create better financial reports in little time.
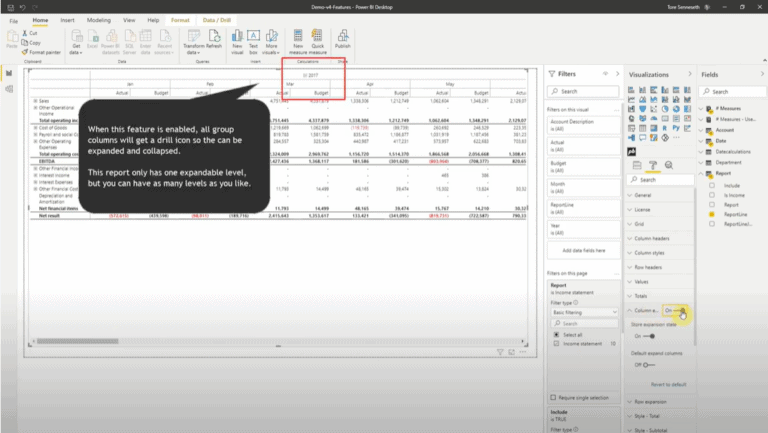
Column expansion option available.
Fine-grained control of cell formatting
We added support for the Format function, which enables formatting specific cells in a column. This feature provides even more fine-grained control to formatting your reports the way you want.
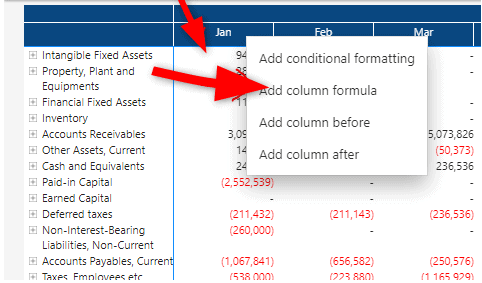
Format function.
Column header improvements
Users can now enable grid lines for just the column headers. This feature makes it easy to view reports with multiple levels of columns, for example, Year, Quarter, Month.
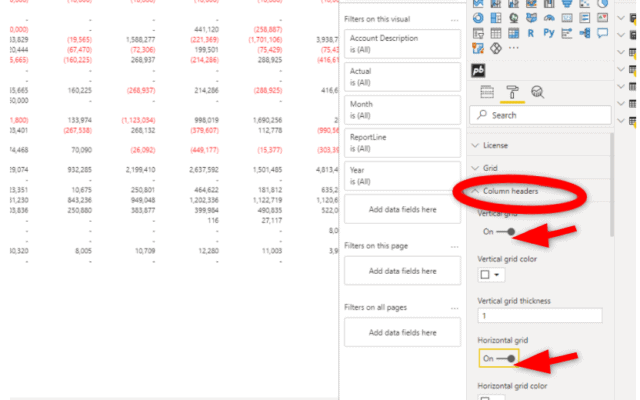
Enabling grid lines.
Column headers for total columns can be customized using caption templating. This feature is useful when you want to customize the column captions of the collapsed subtotal columns. You would typically do this if you were in a non-English speaking country.
Column headers are now always seen within the visible area of its group and screen, even while scrolling horizontally. This makes it easy to understand the context you are in when viewing a report.
Get the latest version
Download Power BI Financial Reporting Matrix v4. Register it as an organizational visual, then import the visual from your organization’s store.
Note
If you are using Power BI Desktop to create reports, make sure it is upgraded to the latest version (December 2020 or later). Power BI Financial Reporting Matrix v4 requires at least version 3.5 of the Power BI API, which is only supported by the December 2020 version or later.
Bug fixes
Bug fixes for version 3.0.5
- Applying a selection when the visual is already pre-filtered now works
- If rows with the same ID/name appears multiple times under different parents, the subtotals and row styling feature now work
Create financial statements easily
Watch our tutorial on how easy it is to make a basic P&L or income statement with the Financial Reporting Matrix.
The Financial Reporting Matrix is a custom visual for creating financial reports in Power BI that complies with financial reporting standards. It can be downloaded from Microsoft Marketplace and enables users to easily create reports such as P&L, income statements, balance sheets, or any tabular report, which require fine-grained control over formatting, calculations, and layout.
The tool supports features such as conditional formatting, row and column expansion, summarization and custom subtotals, styling and formatting rows, columns and cells, custom columns, calculations, and much more. The tool is the fastest – and often the only way – to make accurate financial reports in Power BI. You can now create reports in Power BI that were only possible using Excel before. Make it happen in Power BI is by using this visual today.
Videos
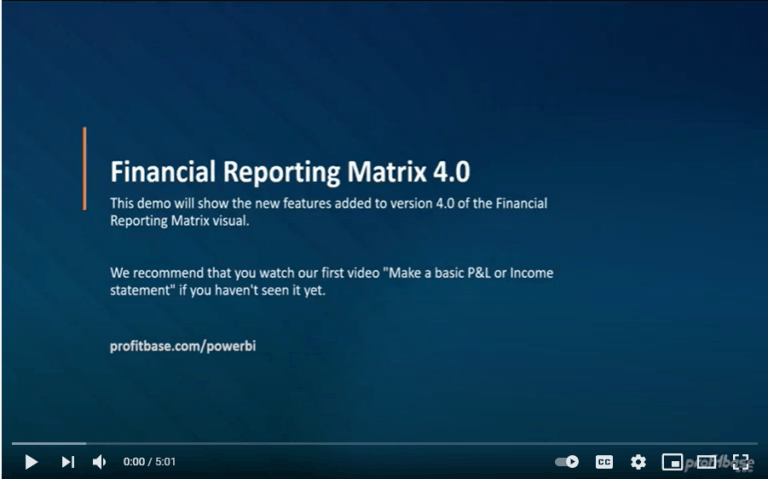
Watch our video on new features in the Power BI Financial Reporting Matrix 4.0.
Watch how to make a basic P&L or income statement.
Keep updated
Subscribe (English or Norwegian) to the Profitbase newsletter to get notified about future updates.