Create amazing financial statements in Power BI.

Start creating financial reports today!
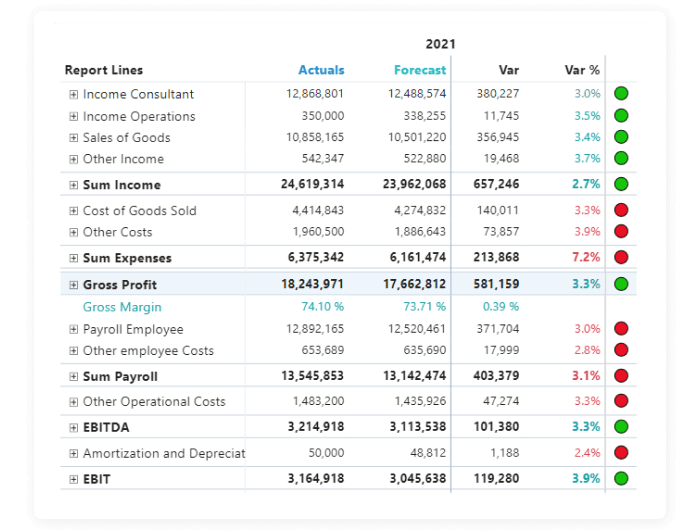
Proper layout
Get the flexibility you need when it comes to layout and formatting – so that you easily can move financial statements to Power BI.
- Simply add subtotals where you want them, with the styling and formatting needed
- Decimal numbers on one row, and a percentage value on the next? – No problem!
- Use blank rows or columns to separate sections of the statements, so the statement looks familiar to your end-users
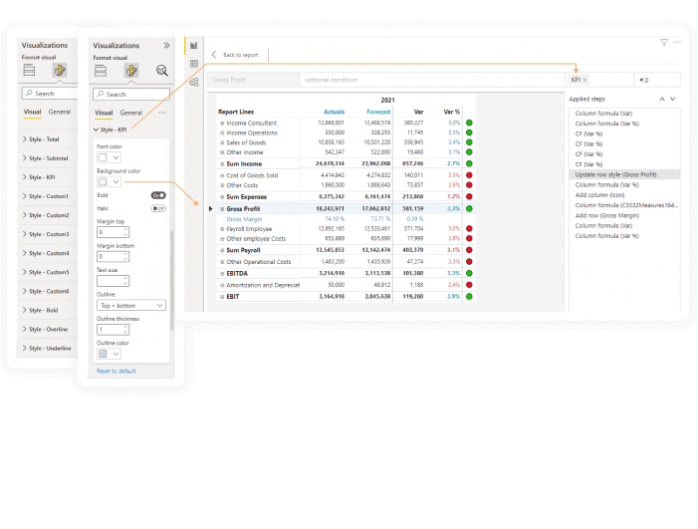
Build the exact report envisioned
Your leader expects that the report should look exactly like the one they have in Excel. Sounds familiar? Luckily, this is now possible.
- With 12 styles to define individually and apply to your rows, you can get the exact look you want
- Over- and underlines, font color and size, background colors, bold and italic
- Format row- and column headers
- Highlight important values or rows
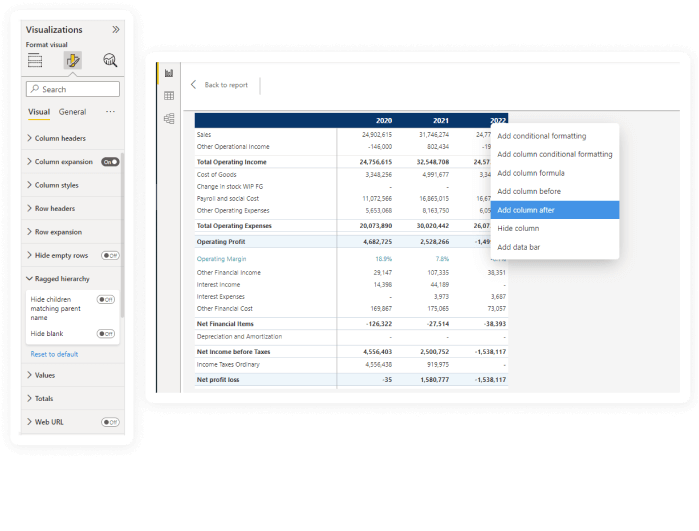
Rich on features
The native matrix is lacking features to create great financial statements.
- Use specific cells in calculations using absolute references
- Add column calculations where needed
- The formula language built into the visual lets you perform calculations with ease
- Calculate your Year-over-Year growth by selecting the relevant columns
- Take care of ragged hierarchies with a click of a button
- Conditionally hide both columns and rows


Want to know more?
Talk with us